Data transformation is the process to convert data from one format, structure, or value set to another. This data transformation is possible in multiple ways like from excel spreadsheet to database, XML document to JSON structure or flat data structure to tabular data structure and others. This can also be viewed as cleaning up of raw source data, validating it and converting it into a suitable form for use.
Most of the times this process of changing the form of data is referred to as Extract Transform Load (ETL). ETL refers to extracting data from its origin, transformation of data and loading of data to a destination data source like a database or data warehouse.
Overview of Power Query
What is Power Query?
Power Query is an ETL tool developed by Microsoft that allows connection to data sources, data extraction, loading and transformation of data. It retrieves the data from data sources, process them, and then loads it into one or more target data sources (systems). Power Query tool available in several Microsoft products, such as Excel, Power BI, and other platforms like SQL Server etc. ETL Stages with Power Query:

- Extract Data – Connects to several data sources like databases, files, web services etc to extract the data.
- Transform Data – Transform the data format and structure by cleaning and reshaping data for use.
- Load Data – Transformed data will be loaded into Power BI for analytics.
Key features of Power Query
Microsoft Power Query is a very flexible and functional tool in the domain of data preparation and transformation. It simplifies the connection process to different data sources, cleans and shapes the data, and loads it into other applications for analysis and reporting.
Business professionals, data analysts, and researchers can use Power Query to enhance all tasks related to data and therefore make more informed decisions.
Key features of Power Query are:

Data Connectivity
Power Query can easily connect to a number of data sources including databases (SQL Server, Oracle, etc.), files (Excel, CSV, XML, JSON), cloud services (Azure, SharePoint, etc.), web pages, and more. It supports integration with Excel and Power BI, to import data and perform data analysis.
Data Transformation
Power Query provides user interface to perform complex data transformations with easy steps and without writing code. It provides multiple actions like filtering of rows, removing duplicates, splitting columns, change of data types, merging of tables, transposing data or applying custom calculations etc. It also supports AI driven features. Power Query uses the M Query Language for more complex transformations and scripting. Transformation steps are recorded, which can be reviewed, edited or removed and helps to understand the transformation process.
Data Cleaning and Shaping
Cleaning of data includes removing of duplicates, correction of errors, filtering out unnecessary data, handling missing values and standardizing formats. Power Query supports aggregation of data which includes various function like sum, average, and data grouping etc. Power Query supports reshaping of data by pivoting or unpivoting columns and is useful for preparing data for reporting.
Data Loading
Using Power Query, transformed data can be loaded into Excel as a table, pivot table, or connection. In Power BI, transformed data can be loaded into the data model for more advanced analytics and for to use in dashboards and reports.
Data Modeling
Power Query is used in building data models in Power BI by loading and then transforming dataset before it is finally fed into the visualizations.
Data Refresh and Query Re-usability
In Power Query, query results can be refreshed (or re-calculated) with updated data from the data source. We don’t need to redo the transformations. This helps to create report templates and can generate recurring reports. Queries created in Power Query can be saved and reused across different projects, saving time and ensuring consistency.
Integration with Other Tools
Power Query is an integral part and easily integrates with several Microsoft products like Excel, Power BI, and other platforms like SQL Server, cloud services etc.
Free of Cost – Power Query is a free tool service in Power BI. It does not require any kind of purchase by the Power BI users.
Benefits of Power Query
- Free of Cost – Power Query is a free tool service in Power BI. It does not require any kind of purchase by the Power BI users.
- Refresh results – Query results can be refreshed (or re-calculated) with updated data from the data source. We don’t need to redo the transformations excluding manual interventions.
- Connect to Data Sources – Power Query supports connection with multiple data sources, including databases like SQL Server and Oracle, cloud services, files like Excel and CSV, or web pages.
- Improve Data quality – It has several built-in functions for data cleaning and transforming. These functions helps in doing data preparation and its quality.
- Query Folding – Power Query supports query folding. This means some of the transformations can be pushed back to the source database for further processing. This brings better performance and reduced load time, especially for large datasets.
- Step-by-Step Capturing – Power Query captures all the steps taken in transformation. This helps to analyse the step by step transformation process.
- M Language – Power Query uses a functional programming language, M.
- Microsoft Integration – It supports easy integration with almost all Microsoft products like Excel, Power BI, and other platforms like SQL Server, cloud services etc.
Cleaning and Shaping of Data
Cleaning and shaping of data ensure that the data is accurate, consistent, and in the correct format. This is a step towards ensuring accuracy in analysis. Power BI’s Power Query Editor has tools for doing this. We can perform many operations like remove needless columns, filter rows, sorting and grouping of data, adjust datatypes to ensure precision, and data in right format and structure. Then we can run queries on this data to get the correct reports.
Data Transformation
We need to follow the following steps to transform raw data into its desired form.
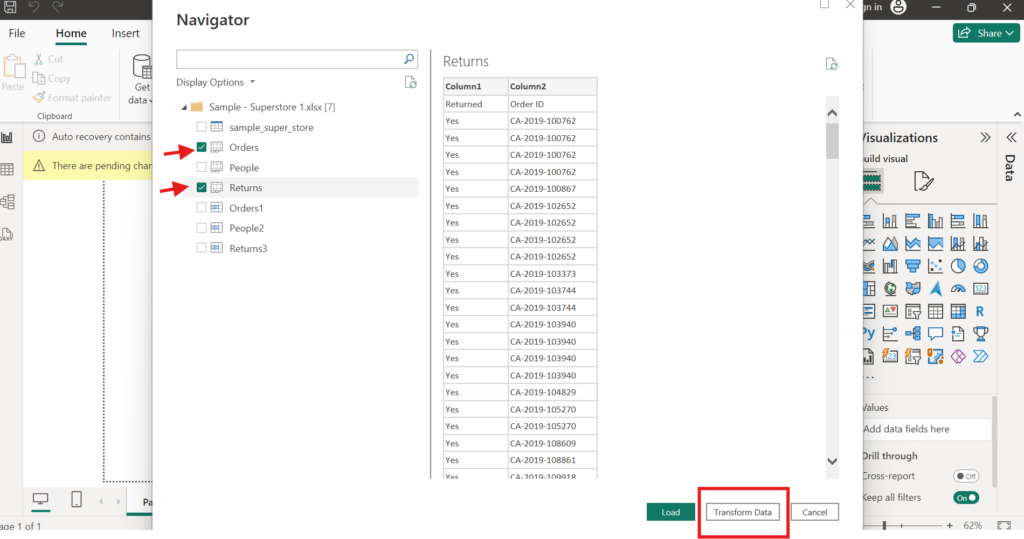
Load Data into Power Query
Click on the Transform Data option to load data from data source (Excel file, CSV, database, etc.) into Power Query.
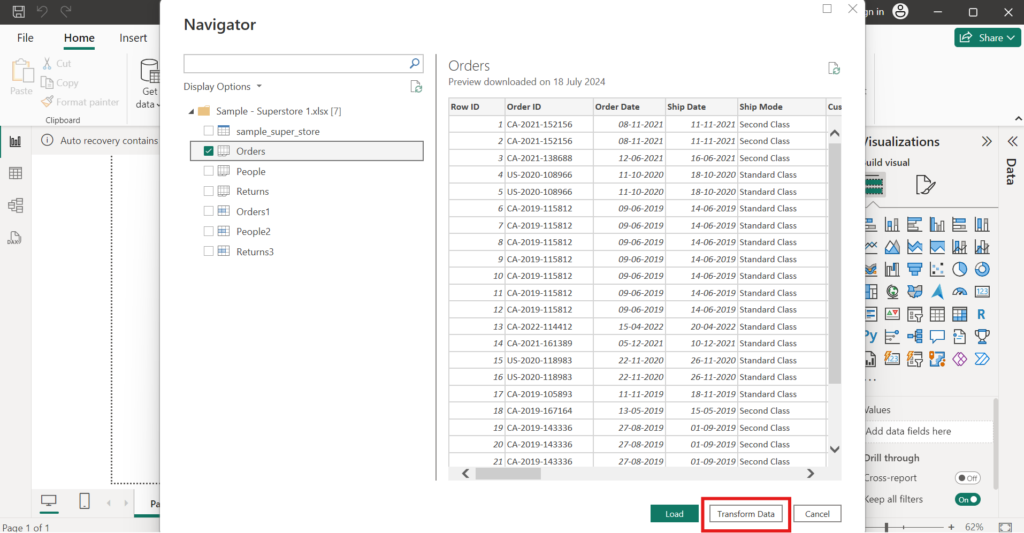
After the dataset is loaded into Power Query, look through the dataset to understand its structure (columns, rows, data types, formats, missing fields, etc.), and identify potential issues which needs to be resolve.
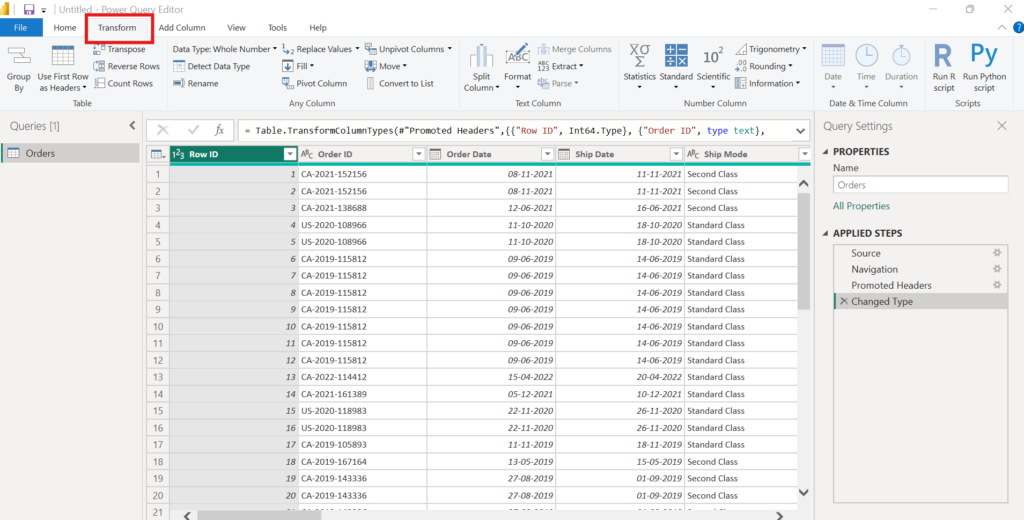
Click on Transform from the from the top menu options present on ribbon. Now we can perform the data transformation steps.
Transformation steps will be recorded and visible under Applied Steps in Query Settings pane.
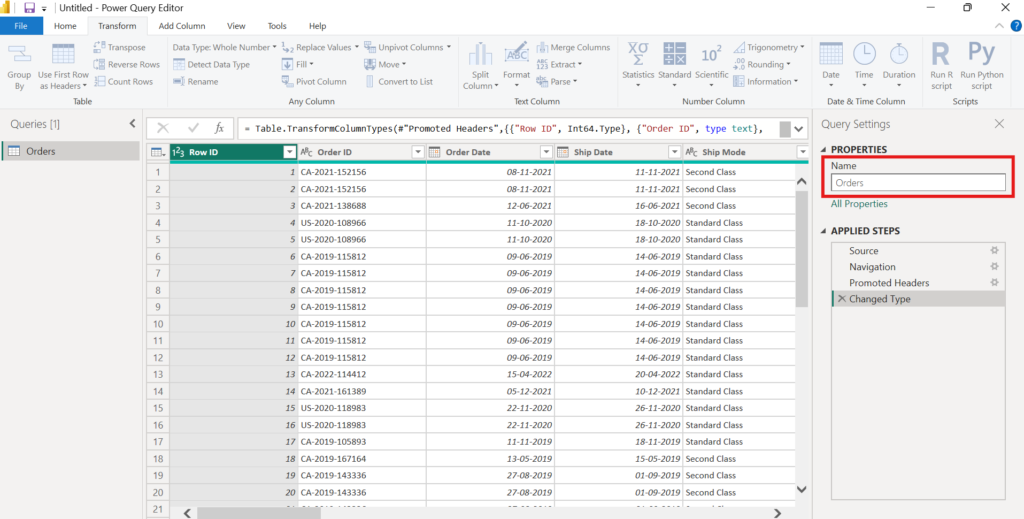
Give the name to the table
We can change the name of the table as per choice in Name section (Query Settings). This shows the query name we are currently working with.
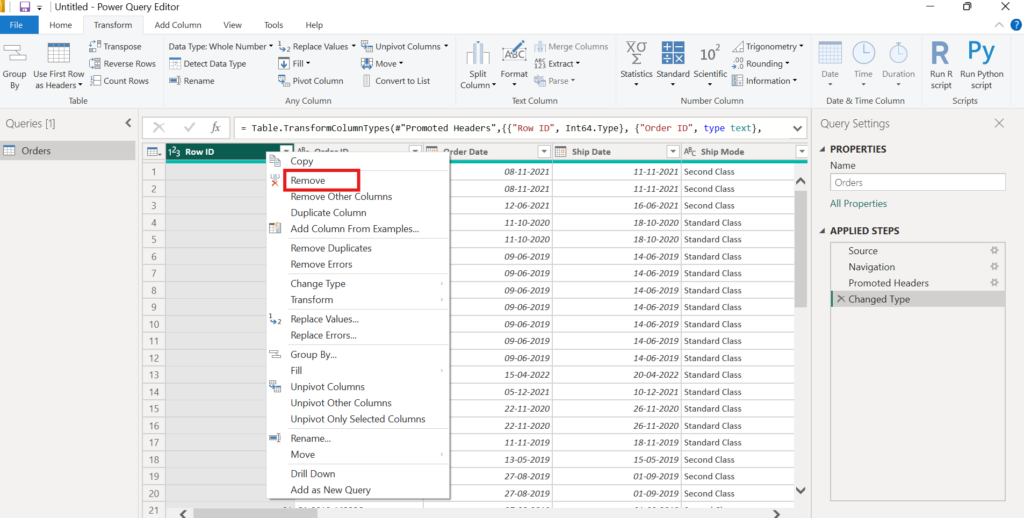
Remove Unnecessary Columns
To remove unwanted or unnecessary columns, right-click on the columns we do not need and select “Remove” or use “Choose Columns” to select only the columns we want to retain.
Delete first, duplicate or alternate Row
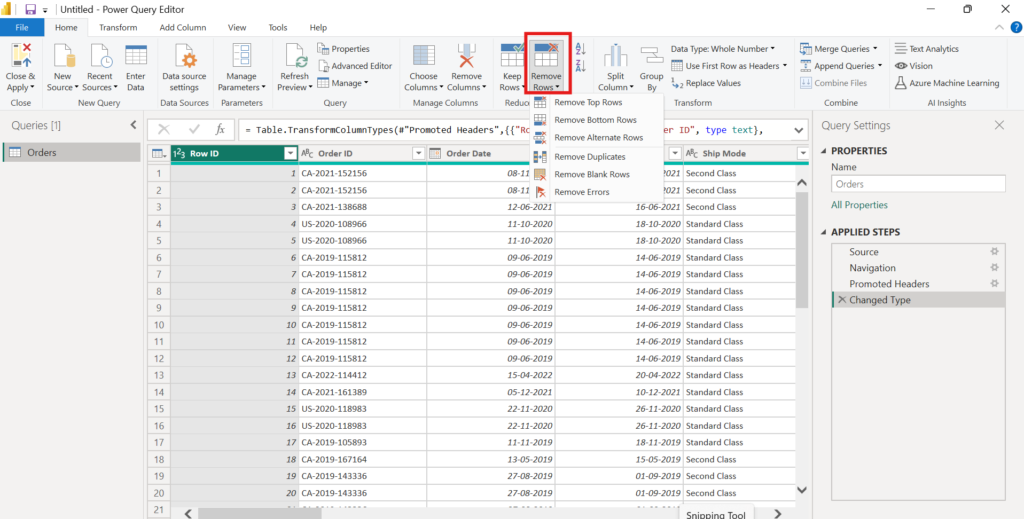
Click the “Home” tab and select “Remove Rows” then click the option for “Remove Top Rows” to delete the top row only (type 1) then click “OK”.
To delete duplicate or alternate row select a respective option in this case and click “Remove Duplicate Rows.”.
Replace Missing Values
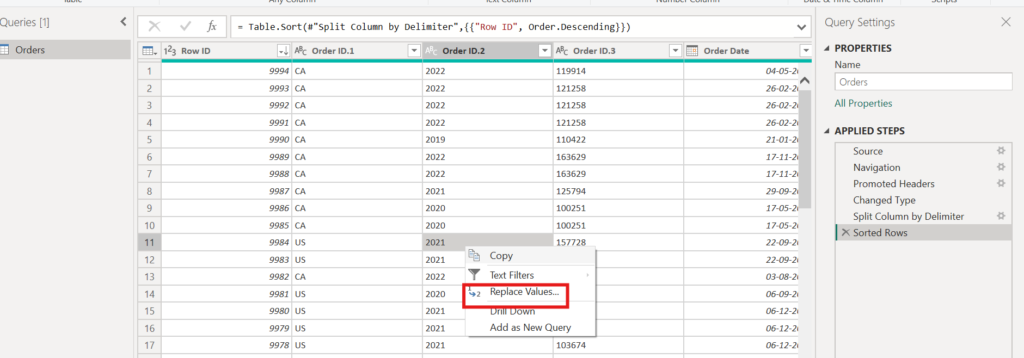
We can replace all missing values in data-set with ‘0 or Null’. Highlight the terms in all the columns that we need to replace the value. Right-Click, on any row containing the missing value and then select “Replace Values” option.
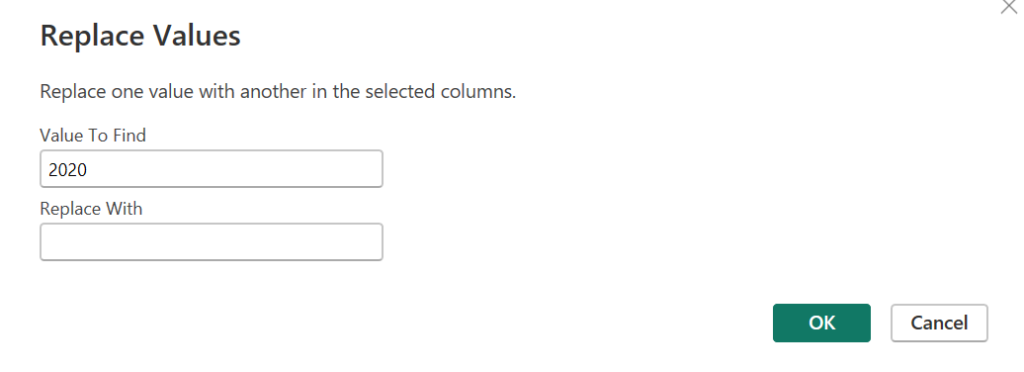
In “Replace Values” window, provide the “Value To Find” (this is the value we want to replace) and “Replace With”. Then click “OK.”
Split Columns
If we have a single column which has values in format separated by any delimiter e.g. column Order ID has values in format CA-2021-152156. This value can be split into three columns with a hyphen (-) delimiter.
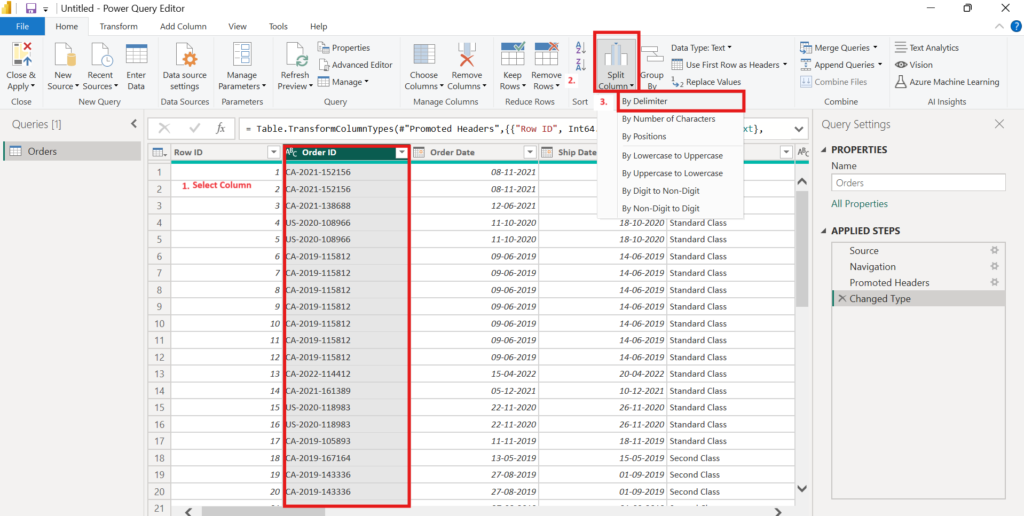
To split a single column values into two or more columns, we have to
- Select the column
- “Right-Click” on the column heading
- There will appear a drop down list, then select “Split Column.”
- Then we opt for “By Delimiter” to split the column.
In the Split Column by Delimiter,
- We can select the delimiter on which column values to be splitted
- We can select the split format based on left most delimiter, right most delimiter or each occurrence of delimiter.
- Other advanced options
- Click “OK”
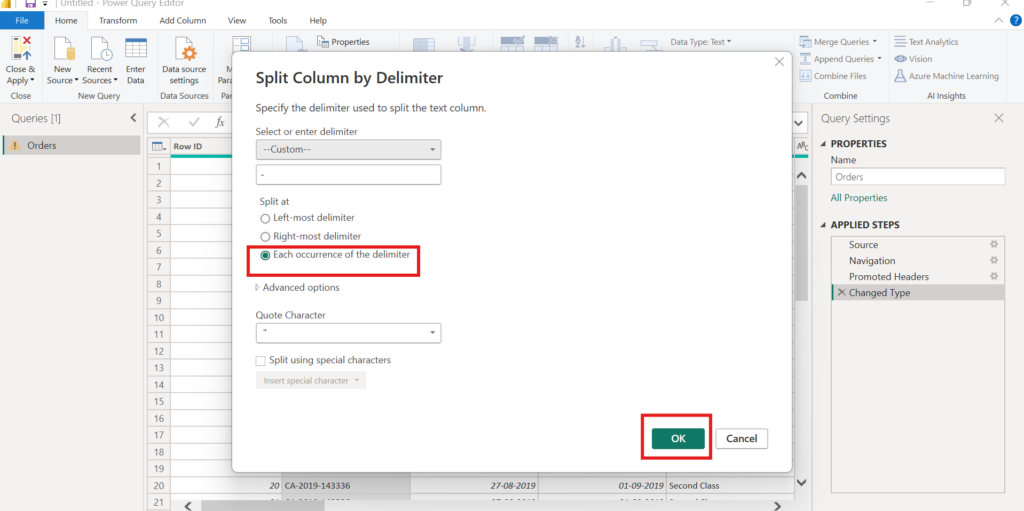
Once the column split is complete, values will be shown in two or more columns based on selected split options.
In our example, each value like CA-2021-152156 were splitted based on hyphen (-) into three columns. Now column values are CA in one column, 2021 in second column and 152156 in third column.
Transformation steps were recorded and shown in Applied Steps.

Merge Columns
Merge column action is reverse of split columns. Merge column is used to merge two or more column values with the given separator into single column. For e.g. if we have three columns each having values like CA, 2021, 152156 respectively and we need to merge these values into single column with a hyphen (-) separator.
To merge two or more columns into a single column
- First select the two or more columns we need to merge.
- Go to “Text Column” section in Ribbon
- Select “Merge Columns” option.
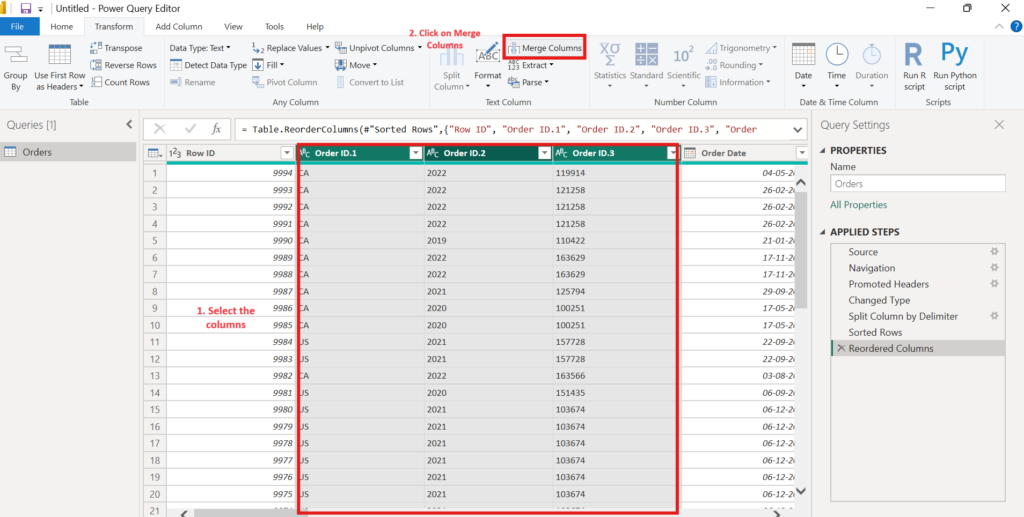
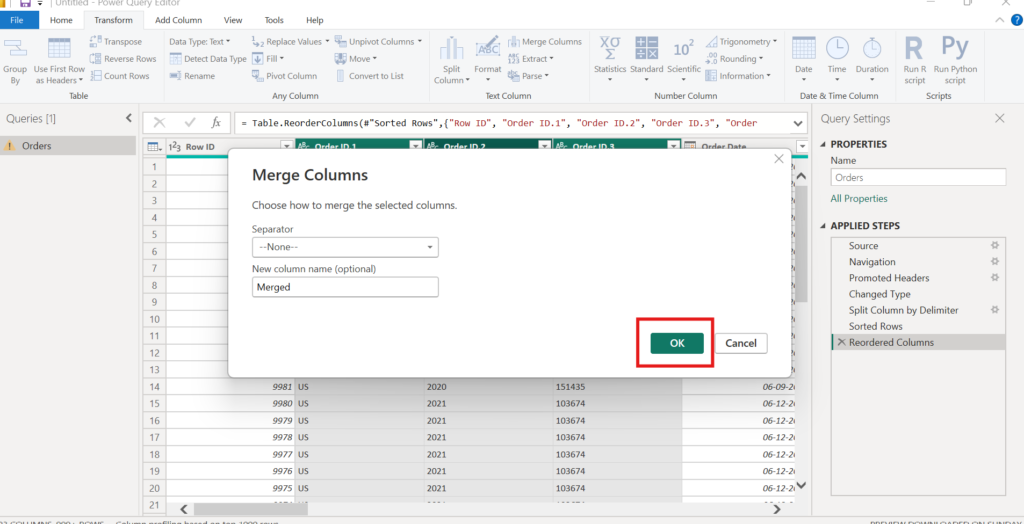
Merge Column Options
- In the Merge Columns window, we can provide the separator to be used between the merged values
- It’s a good practice to provide the New column name for merge values.
- Click “OK”.
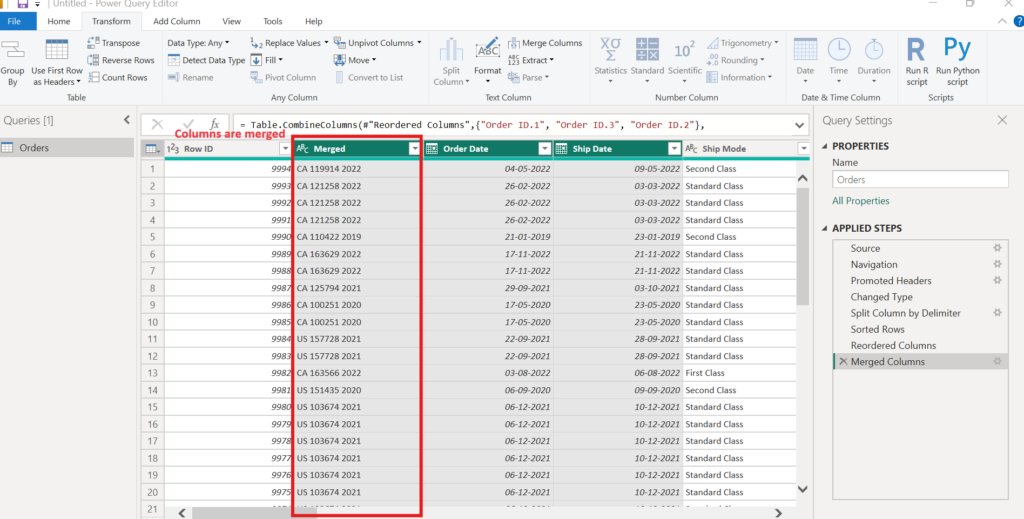
Once the column merge is complete, a new column with the given name will be created and will have merged values from two or more columns.
In our example, we selected three columns each having value CA, 2021, 152156 respectively. These columns will be merged with hyphen (-) as separator. Merged column will have value like CA-2021-152156.
Transformation steps were recorded and shown in Applied Steps.
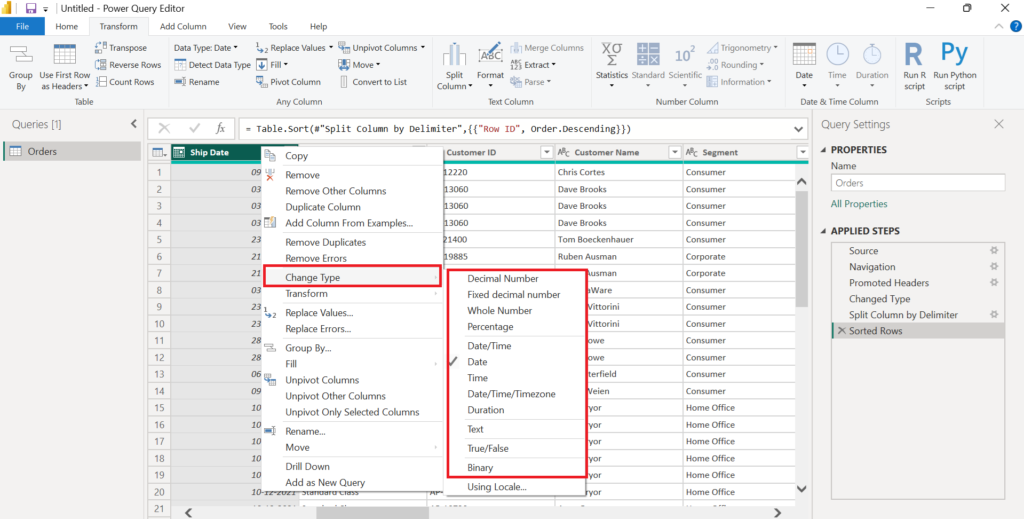
Change Data Type
To change the data type of a columns,
- Select the column and “Right-Click” on the column header.
- A drop-down list will appear, select “Change Type.”
- Now, again a drop-down list will appear with different data types.
- Select the changed data type for the column.
Create Pivot Columns
We can create a table with Power Query that has an aggregate value for each unique value in a column. Power Query groups each unique value and makes an aggregate calculation for every value, then it pivots the columns into a new table.

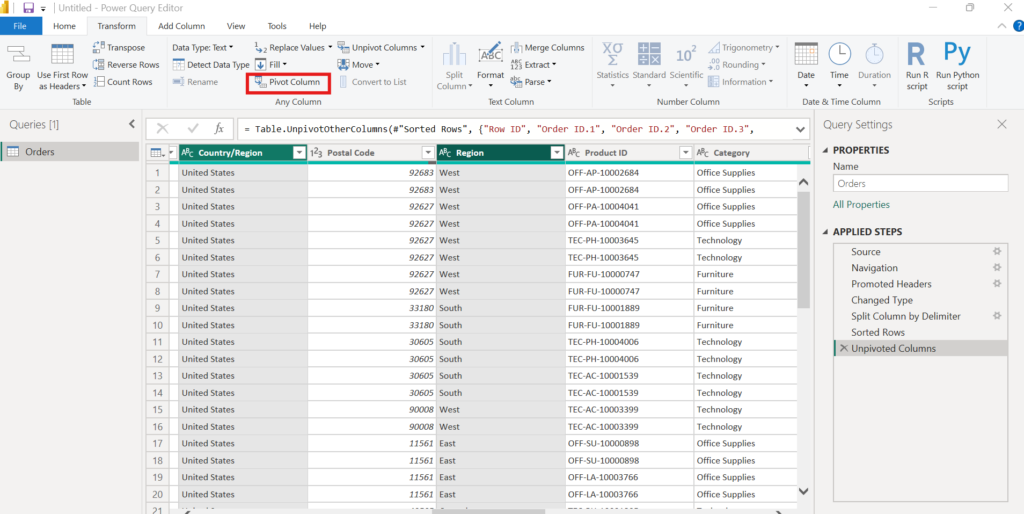
To create a Pivot Table based on columns,
- First select columns whose values we want to aggregate
- Then from the “Ribbon”, select the option of “Pivot Columns”
- Then in the Pivot Column page, select the value column
- Click “OK”.
Create Unpivot Columns
Unpivot column means unpacking the similar values and group them under a single heading. Power Query ungroups selected aggregate columns into a unique value in single columns into a new table.

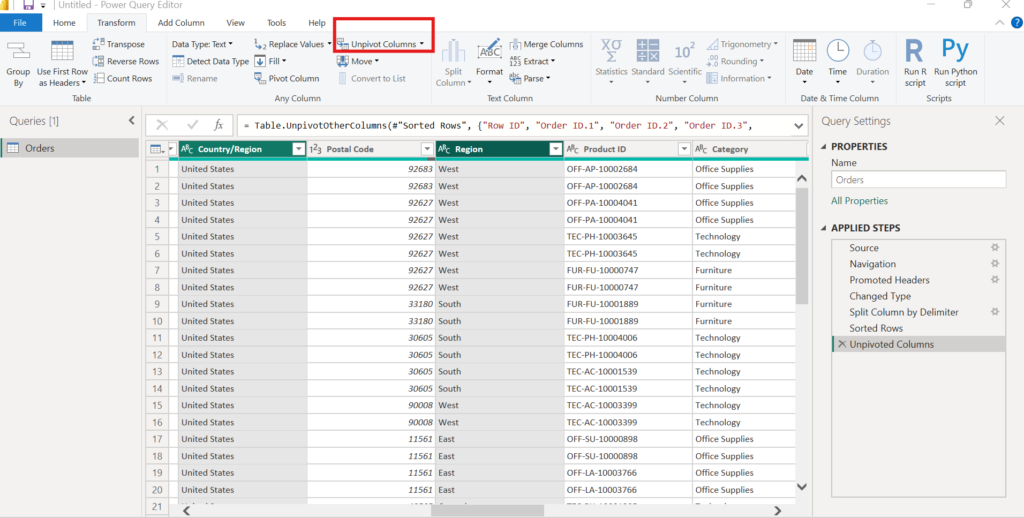
To create an unpivot table based on the given columns,
- Select all columns for unpivot
- Right-click on any of the columns heading
- Then select “Unpivot Columns” from the “Ribbon” section.
- It will result in new columns.
- We can modify the name of the column.
Merge and Append Queries
In Power Query, we can perform both merge and append operations for combining data that results from different queries or tables. They serve different purposes and are used in different scenarios.
Merge Queries
Merge is used to join two tables (queries) together based on a common column or a set of columns. We can use Merge when we need to combine columns from two tables (or queries) based on a matching key. This is similar to performing a JOIN operation in SQL.
Merge – Joins tables horizontally (side by side) based on matching key columns.
- Load the two queries (tables) we want to merge into the Power Query Editor.
- Identify a main table – Click on one of the tables in Power Query Editor via the Queries pane, make it the primary table.
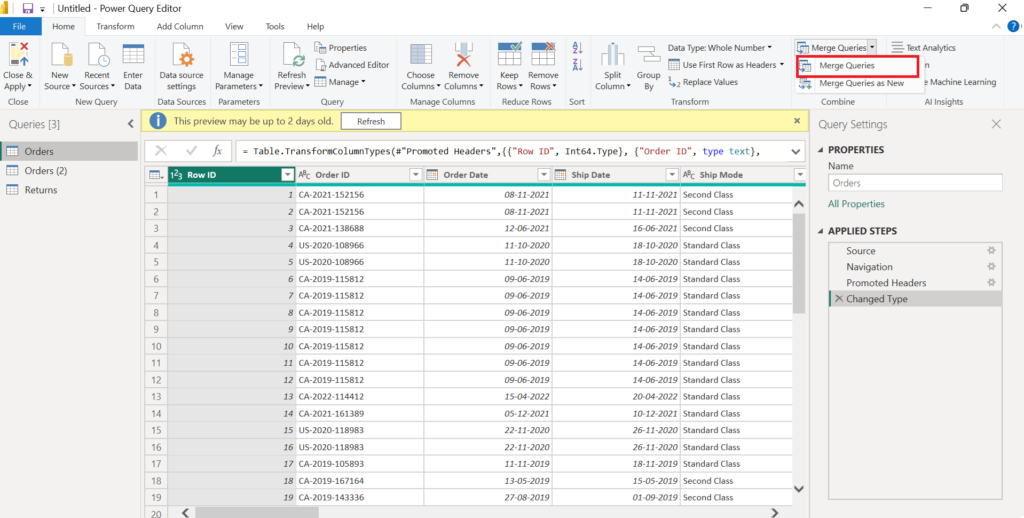
- In the Power Query Editor, go to the Home tab and select Merge Queries.
- We can choose from the two options “Merge Queries” (merges into the current query) or “Merge Queries as New” (creates a new query for the merged data).
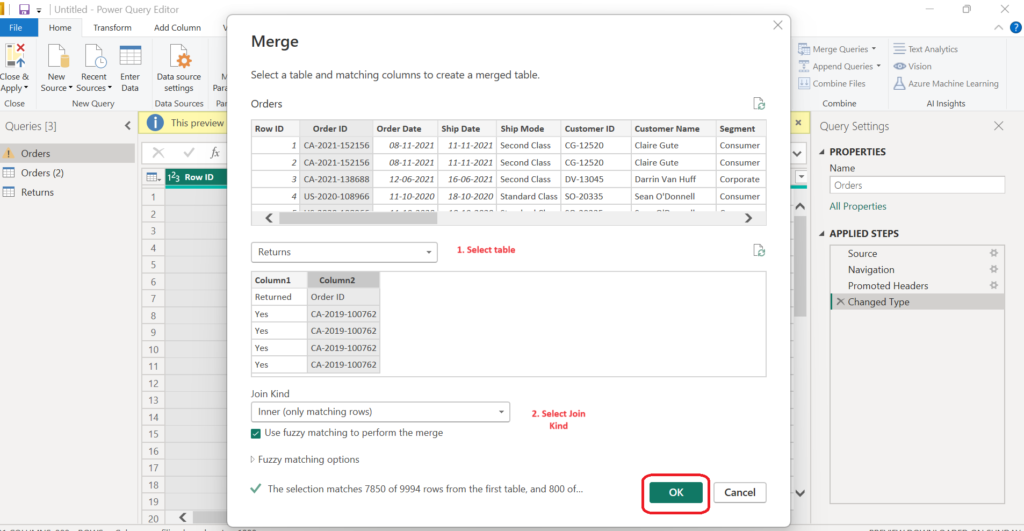
- Select the first table from the dropdown and then select the columns to use as the key for merging.
- Repeat this step for the second table.
- Choose the type of join (e.g., Left Join, Inner Join, etc.) depending on how we want the data to be merged.
- Click “OK”.
Append Queries
Append is used when we want to combine two or more tables with the same structure (like a UNION operation in SQL).
Append – Combines tables vertically, adding rows from one table to another.
- Load the queries (tables) to append into the Power Query Editor.
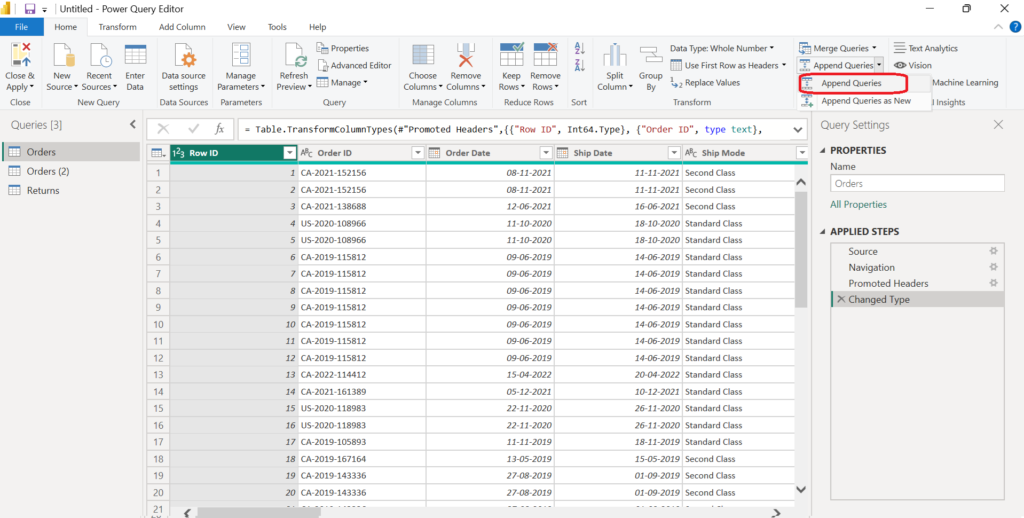
- In the Power Query Editor, go to the Home tab and select Append Queries.
- Select between the two options “Append Queries” (appends to the current query) or “Append Queries as New” (creates a new query for the appended data).
- In the Append dialog, select either one of the option: “Two tables” OR “Three or more tables” if you have multiple.
- In case of “Three or more tables,” we are allowed to select the tables from the list.
- Click OK.
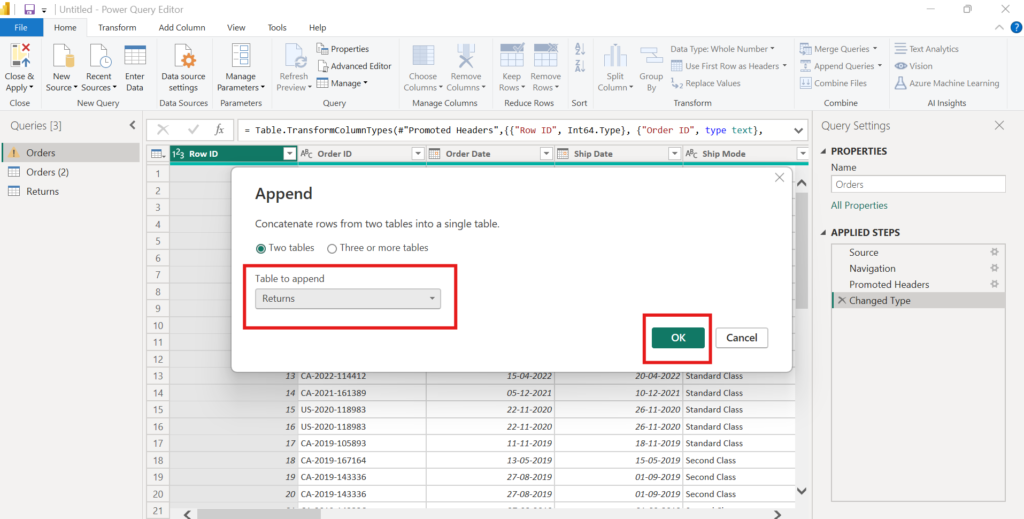
Once appended, the new table will show all rows from the tables selected. Verify the column names are consistent that were supposed to match.
Once appended click on close and load to take the data back to Excel or continue with further transformations.
Creating Columns in Power Query
In Power Query, creating column is the primary task when we are dealing with data transformation. There are two type of methods we can use to create column:
- Adding a new calculated column
- Transforming the existing column
Some of the ways to create columns in Power Query are:
Add Conditional Column
Conditional Column works like the IF-Else statement in Excel. It creates columns based on conditions and logic.
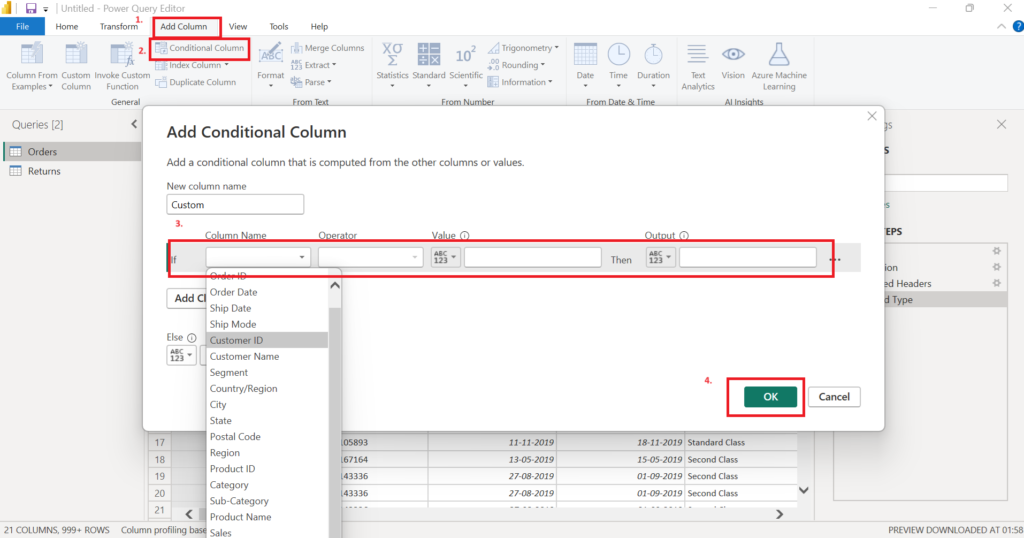
Let us suppose we want to state the country abbreviations, based on the group they are. For example: We want to pick the USA for all the groups whose name starts with the word ‘America’. We can do so by following these steps:
- Click “Add Column”.
- Click on “Conditional Column”. It will open a dialog for “Add Conditional Column” where we can specify the conditions.
- First, provide the name to a new column. By default, it sets the name as ‘Custom’.
- Fill the condition as per your requirement and click on “OK.”
Add a Custom Column
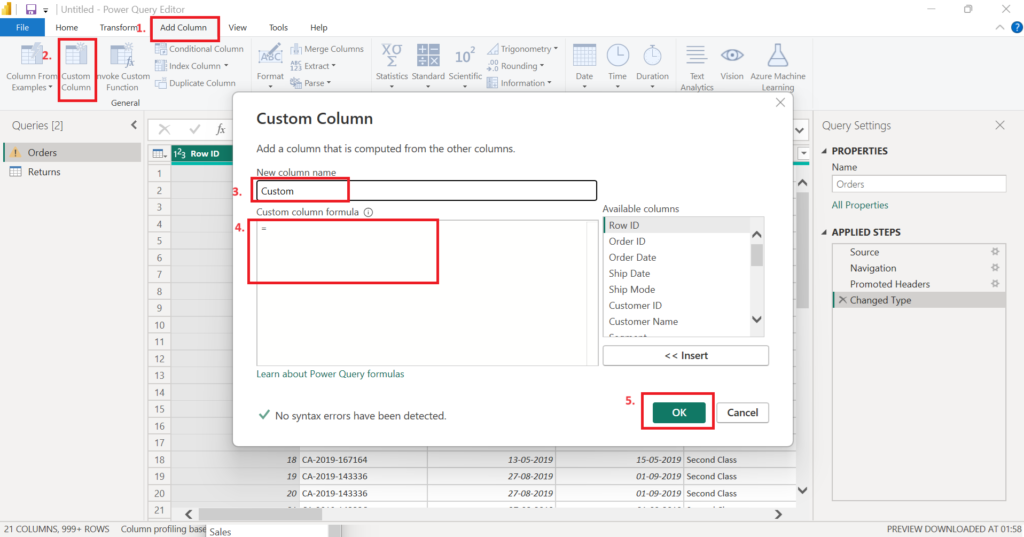
To add a custom column using a formula or expression:
- Load your data into Power Query.
- Navigate to the Power Query Editor and click on the “Add Column” tab found in the command ribbon.
- Click the “Custom Column” button. “Custom Column” dialog will open.
- Write the name of your new column followed by formula.
- After typing the formula, click OK.
- New column will be added to the query results.
Once the transformation is complete, we can apply those changes and load the data back to workbook or entity.
Summary
In this article, we learned about Power Query and its features to transform data. Following topics were covered:

Very good information Kudos!