
In Python, numpy.meshgrid() is a useful function from the NumPy library. It is particularly useful for generating 2-Dimensional coordinate grids (or matrices) from two 1-Dimensional arrays representing the x-axes and y-axes. The generated coordinate grids are used in many applications, such as plotting 3-D surfaces, numerical computing in partial differential equations, grid based simulation in physics, solving mathematical problems, and image processing.
In previous articles, we learned about NumPy Arrays and How to create NumPy Arrays using Lists or Tuples or using different methods like np.arange(), np.linspace() and np.logspace(). In this tutorial, we will explain the concept of meshgrid() in detail, demonstrate how to use it, and explore common applications of the function.
numpy.meshgrid() – Generate Coordinate Matrices in NumPy
The numpy.meshgrid() function takes two 1-Dimensional arrays and returns two 2-Dimensional arrays (matrices) representing all the possible pairs of coordinates in the Cartesian plane. Each output array represents the grid coordinates of either the x or y dimension. In simpler terms, meshgrid() “spreads” one 1-D array along the x-axis and another along the y-axis to generate a full grid of coordinates.
Syntax => numpy.meshgrid(*xi, copy=True, sparse=False, indexing='xy')
numpy.meshgrid(*xi, copy=True, sparse=False, indexing='xy')*xi– Represent grid point for each dimension in 1-D arrays. In the 2-D grid, it represents arrays of x-values and y-values.copy(optional) – The default value isTrue, which helps create a copy of the array. IfFalse, changes are allowed to be made in place.sparse(optional) – It produces Sparse matrices to save memory used in large grids, only ifsparseisTrue.indexing(optional) – Cartesian indexing ('xy', default), wherexis first dimension andyis the second dimension. Matrix indexing ('ij'), here first dimensions correspond to row indices(i) and column indices(j).
Example Basic Syntax => X, Y = np.meshgrid(x, y)
- x is a 1-D array representing the x-coordinates.
- y is a 1-D array representing the y-coordinates.
- X is a 2-D array containing the x-coordinates of the mesh grid.
- Y is a 2-D array containing the y-coordinates of the mesh grid.
How numpy.meshgrid() Works
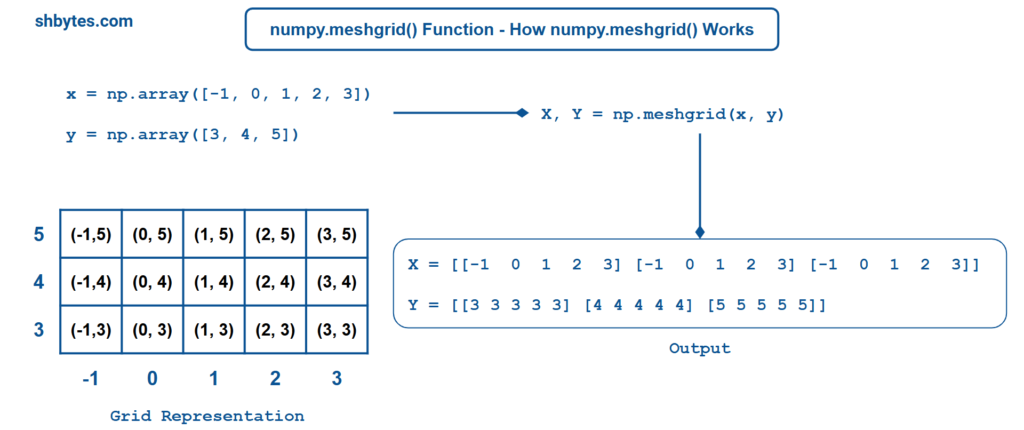
Let’s start by understanding how numpy.meshgrid() works with a simple example. Suppose we have two 1-D arrays x and y:
import numpy as np

x = np.array([-1, 0, 1, 2, 3]) # NumPy array for x coordinates
y = np.array([3, 4, 5])        # NumPy array for y coordinates
X, Y = np.meshgrid(x, y)   # X and Y resulting grid coordinates
print(X)
# Output => [[-1  0  1  2  3]
#            [-1  0  1  2  3]
#            [-1  0  1  2  3]]
print(Y)
# Output => [[3 3 3 3 3]
#            [4 4 4 4 4]
# [5 5 5 5 5]]- The
xarray =>[-1, 0, 1, 2, 3]and theyarray =>[3, 4, 5] Xis the 2-D array containing the x-coordinates, repeating each value ofxfor every value iny. =>[[-1 0 1 2 3] [-1 0 1 2 3] [-1 0 1 2 3]]Yis the 2-D array containing the y-coordinates, repeating each value ofyfor every value inx. =>[[3 3 3 3 3] [4 4 4 4 4] [5 5 5 5 5]]- Together,
XandYform a grid of coordinates.XandYare coordinate matrices, where each point(x,y)represents a pair of coordinates on the grid. We can visualize this 2-D grid as a set of points in the Cartesian plane.
Create numpy.meshgrid() using linspace() Function
import numpy as np

x = np.linspace(-3, 3, 7, dtype=int)   # NumPy array for x coordinates
y = np.linspace(-5, 4, 10, dtype=int) # NumPy array for y coordinates
X, Y = np.meshgrid(x, y)   # X and Y resulting grid coordinates
print(X)
# [[-3 -2 -1  0  1  2  3]
#  [-3 -2 -1  0  1  2  3]
#  [-3 -2 -1  0  1  2  3]
#  [-3 -2 -1  0  1  2  3]
#  [-3 -2 -1  0  1  2  3]
#  [-3 -2 -1  0  1  2  3]
#  [-3 -2 -1  0  1  2  3]
#  [-3 -2 -1  0  1  2  3]
#  [-3 -2 -1  0  1  2  3]
#  [-3 -2 -1  0  1  2  3]]

print(Y)
# [[-5 -5 -5 -5 -5 -5 -5]
#  [-4 -4 -4 -4 -4 -4 -4]
#  [-3 -3 -3 -3 -3 -3 -3]
#  [-2 -2 -2 -2 -2 -2 -2]
#  [-1 -1 -1 -1 -1 -1 -1]
#  [ 0  0  0  0  0  0  0]
#  [ 1  1  1  1  1  1  1]
#  [ 2  2  2  2  2  2  2]
#  [ 3  3  3  3  3  3  3]
#  [ 4  4  4  4  4  4  4]]
np.linspace(-3, 3, 7, dtype=int)createsxarray =>[-3, -2, -1, 0, 1, 2, 3]np.linspace(-5, 4, 10, dtype=int)createsyarray =>[-5, -4, -3, -2, -1, 0, 1, 2, 3, 4]Xis the 2-D array containing the x-coordinates, repeating each value ofxfor every value iny.Yis the 2-D array containing the y-coordinates, repeating each value ofyfor every value inx.- Together,
XandYform a grid of coordinates.XandYare coordinate matrices, where each point(x,y)represents a pair of coordinates on the grid. We can visualize this 2-D grid as a set of points in the Cartesian plane.
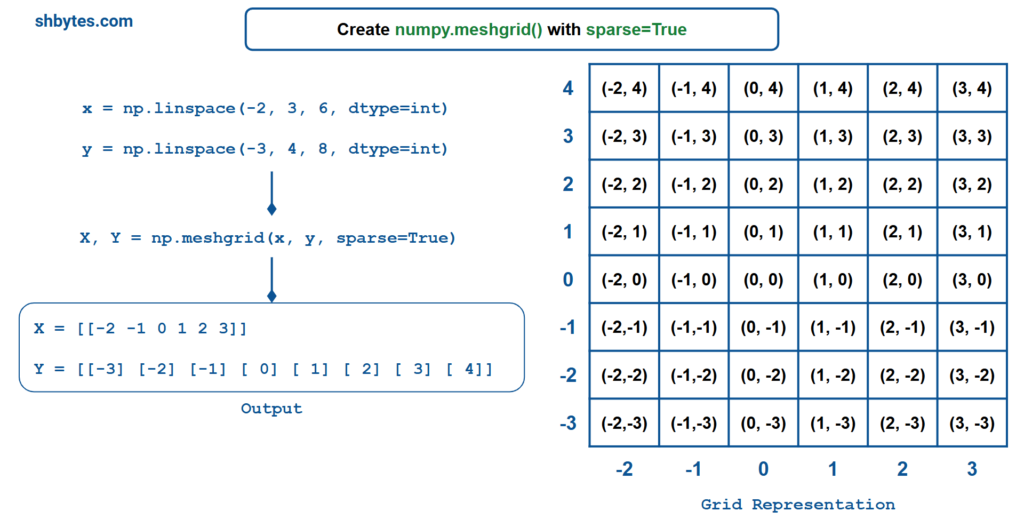
Create numpy.meshgrid() with sparse=True
import numpy as np

x = np.linspace(-2, 3, 6, dtype=int)  # NumPy array for x coordinates
y = np.linspace(-3, 4, 8, dtype=int) # NumPy array for y coordinates
X, Y = np.meshgrid(x, y, sparse=True)   # X and Y resulting grid coordinates
print(X)
# [[-2 -1  0  1  2  3]]

print(Y)
# [[-3]
#  [-2]
#  [-1]
#  [ 0]
#  [ 1]
#  [ 2]
#  [ 3]
#  [ 4]]
np.linspace(-2, 3, 6, dtype=int)createsxarray =>[-2, -1, 0, 1, 2, 3]np.linspace(-3, 4, 8, dtype=int)createsyarray =>[-3, -2, -1, 0, 1, 2, 3, 4]Xis the 2-D array containing the x-coordinates, repeating each value ofxfor every value iny. =>[[-2 -1 0 1 2 3]]Yis the 2-D array containing the y-coordinates, repeating each value ofyfor every value inx.- Together,
XandYform a grid of coordinates.XandYare coordinate matrices, where each point(x,y)represents a pair of coordinates on the grid. We can visualize this 2-D grid as a set of points in the Cartesian plane.
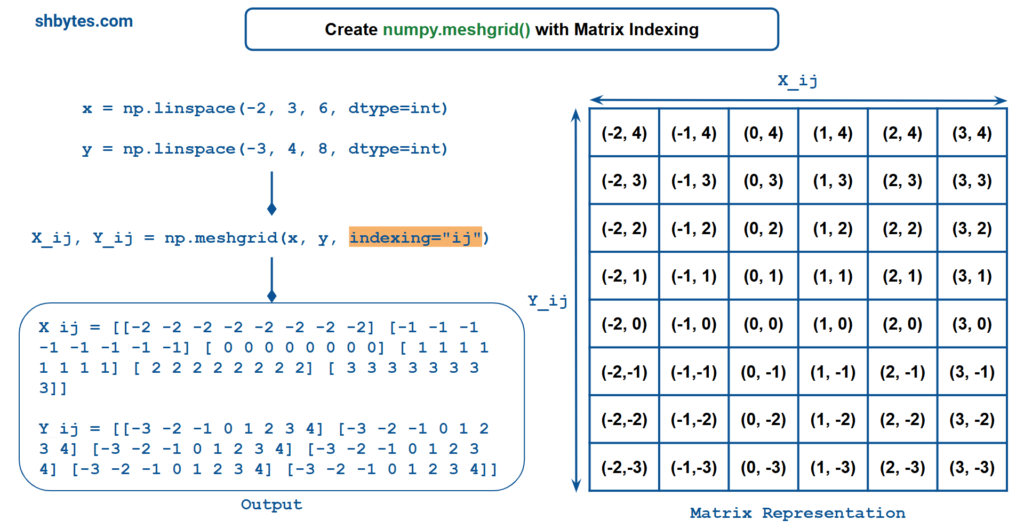
Create numpy.meshgrid() with Matrix Indexing
import numpy as np

x = np.linspace(-2, 3, 6, dtype=int)  # NumPy array for x coordinates
y = np.linspace(-3, 4, 8, dtype=int) # NumPy array for y coordinates
X_ij, Y_ij = np.meshgrid(x, y, indexing="ij")   # X_ij and Y_ij resulting grid coordinates
print(X_ij)
# [[-2 -2 -2 -2 -2 -2 -2 -2]
#  [-1 -1 -1 -1 -1 -1 -1 -1]
#  [ 0  0  0  0  0  0  0  0]
#  [ 1  1  1  1  1  1  1  1]
#  [ 2  2  2  2  2  2  2  2]
#  [ 3  3  3  3  3  3  3  3]]

print(Y_ij)
# [[-3 -2 -1  0  1  2  3  4]
#  [-3 -2 -1  0  1  2  3  4]
#  [-3 -2 -1  0  1  2  3  4]
#  [-3 -2 -1  0  1  2  3  4]
#  [-3 -2 -1  0  1  2  3  4]
#  [-3 -2 -1  0  1  2  3  4]]
np.linspace(-2, 3, 6, dtype=int)createsxarray =>[-2, -1, 0, 1, 2, 3]np.linspace(-3, 4, 8, dtype=int)createsyarray =>[-3, -2, -1, 0, 1, 2, 3, 4]X_ijis the 2-D array containing the x-coordinates, repeating each value ofxfor every value iny. =>[[-2 -1 0 1 2 3]]Y_ijis the 2-D array containing the y-coordinates, repeating each value ofyfor every value inx.- Together,
XandYform a grid of coordinates.X_ijandY_ijare coordinate matrices, where each point(x,y)represents a pair of coordinates on the grid. We can visualize this 2-D grid as a set of points in the Matrix.
Using numpy.meshgrid() to Plot 3-D surface
One common use case for meshgrid() is in 3-D surface plotting. For a function of two variables $z = f(x, y)$, we can use meshgrid() to create a grid of $(x, y)$ values, then evaluate $f(x, y)$ at each grid point to get the corresponding $z$-values.
Let’s plot the surface of the function $z = \sin(x^{2} + y^{2})$ over a 2-D grid.
import numpy as np
import matplotlib.pyplot as plt

x = np.linspace(-5, 5, 20) # NumPy array for x coordinates
y = np.linspace(-5, 5, 20) # NumPy array for y coordinates

X, Y = np.meshgrid(x, y) # Create the meshgrid
Z = np.sin(X**2 + Y**2) # Compute Z values based on the function

# Create a 3D plot
fig = plt.figure()
ax = fig.add_subplot(111, projection='3d')
ax.plot_surface(X, Y, Z, cmap='viridis')
plt.show() # Show the plot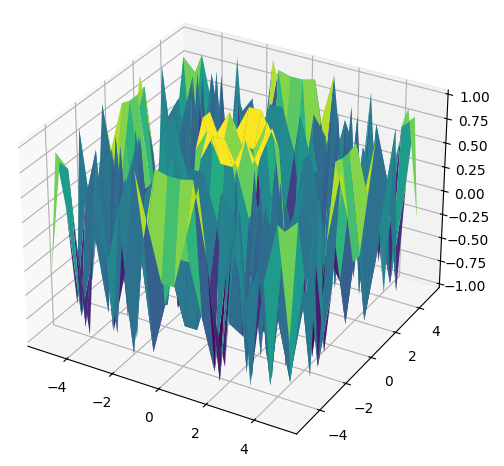
xandyare defined as evenly spaced values between -5 and 5.np.meshgrid(x, y)generates the 2-D grid of points.Z = np.sin(X**2 + Y**2)computes the value of the function at each grid point.- The
plot_surface()method from matplotlib is used to create a 3-D surface plot.
Applications of numpy.meshgrid() Function
Here are a few common use cases for numpy.meshgrid().
Evaluating Functions on a Grid
We can use numpy.meshgrid() to evaluate any mathematical function over a 2-D grid. For example, to evaluate the function $f(x, y) = x^{2} + y^{2}$ over a grid of values:
x = np.linspace(-3, 3, 7)
y = np.linspace(-2, 2, 5)
X, Y = np.meshgrid(x, y)
Z = X**2 + Y**2
print(Z)
# [[13.  8.  5.  4.  5.  8. 13.]
#  [10.  5.  2.  1.  2.  5. 10.]
#  [ 9.  4.  1.  0.  1.  4.  9.]
#  [10.  5.  2.  1.  2.  5. 10.]
#  [13.  8.  5.  4.  5.  8. 13.]]
Vector Fields
We can visualize vector fields (e.g., magnetic fields, fluid dynamics) using meshgrid() to generate a grid of points where we can compute the vector components at each point.
Image Processing
In image processing, the meshgrid() function can be used to generate coordinates corresponding to each pixel of an image. These coordinates can be used to manipulate image data, perform transformations, or apply filters.
Contour Plots
We can create contour plots (2-D projections of 3-D surfaces) using meshgrid().
import numpy as np
import matplotlib.pyplot as plt

x = np.linspace(-5, 5, 100)
y = np.linspace(-5, 5, 100)
X, Y = np.meshgrid(x, y)
Z = np.sin(X**2 + Y**2)
plt.contour(X, Y, Z)
plt.title("Contour plot of z = sin(x^2 + y^2)")
plt.show()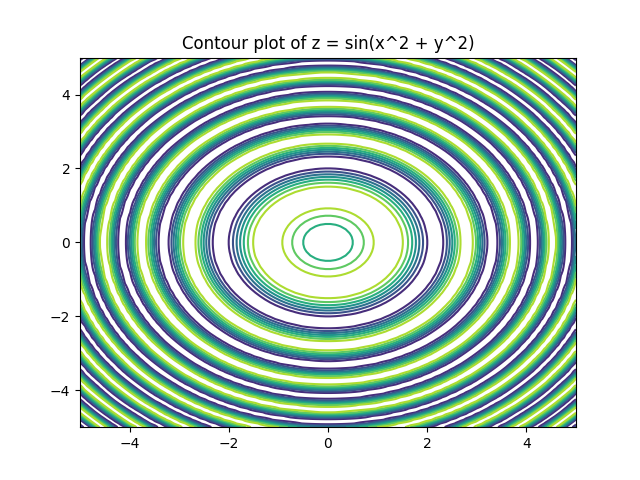
Conclusion
The numpy.meshgrid() function is a powerful tool for generating coordinate matrices that simplify the creation of multidimensional grids for various numerical computations and visualizations. By understanding how meshgrid() works and how it integrates with functions like linspace(), you can create finely tuned coordinate grids for 2-D or 3-D plotting and simulations.
The ability to generate sparse grids and utilize matrix indexing further enhances its flexibility, allowing for optimized performance in larger datasets. Whether for surface plotting, contour mapping, or solving complex mathematical problems, numpy.meshgrid() proves to be an essential function for working with multi-dimensional arrays in Python, particularly in scientific computing and data visualization.
Code snippets and programs related to numpy.meshgrid() Function and other topics covered in this tutorial, can be accessed from GitHub Repository. This GitHub repository all contains programs related to other topics in NumPy tutorial.
Related Topics
- numpy.meshgrid() Function – Generate Coordinate Matrices in NumPyIn Python, numpy.meshgrid() is a useful function from the NumPy library. It is particularly useful for generating 2-Dimensional coordinate grids (or matrices) from two 1-Dimensional arrays representing the x-axes and y-axes. The generated coordinate grids are used in many applications, such as plotting 3-D surfaces, numerical computing in partial differential equations, grid based simulation in physics, solving…
- numpy.array(): Create NumPy Arrays using Lists, Tuples and Arrays (with Example Programs)NumPy (Numerical Python) is one of the most powerful libraries for numerical computations, data manipulation, and analysis in Python. At the core of NumPy is the ndarray, a multi-dimensional or N-dimensional array that allows to store and manipulate large datasets efficiently. NumPy provides several ways to create arrays, from simple ones to more complex multi-dimensional…
- numpy.arange(): Create Array of Evenly Spaced Numbers within a Range (with Example Programs)NumPy library provides various functions to create arrays with evenly spaced numbers within range. In previous tutorials, we learned about Key Features of NumPy Arrays in Python. In this tutorial, we will learn to create NumPy arrays using numpy.arrange() function. numpy.arange() to Create Array of Evenly Spaced Numbers within a Range numpy.arange() is used to create…
- NumPy Array in Python: First Step into Numerical PythonNumPy array in Python are basic entities for numerical computations. They originate from the NumPy library, an essential package in Python for scientific computing. A NumPy array also termed as ndarray, is highly efficient and an object of multi-dimensional array (N-dimensional array), which provides the base functions of numerical operations. Being NumPy Arrays an essential…
- NumPy Array Attributes | ndarray Attributes (with Example Programs)NumPy (Numerical Python) is a powerful library for numerical computing in Python. It provides support for large multidimensional arrays and matrices, and it also provides a collection of mathematical functions to operate on these arrays. Understanding the attributes of NumPy arrays is essential for efficiently working with them. In previous articles, we learned about NumPy…